A Trader's Guide to Seasonality
What if you had a REAL advantage in the markets?
I’m not talking about a secret indicator or a complex trading strategy. I’m talking about something that’s been proven for decades. A predictable rhythm. A pulse that beats within every market, from the S&P500 to Bitcoin. In this article, you'll learn how it works.
Let's Get Practical: The Power of a "Seasonal Chart"
So how do we actually see this rhythm? Let's take the S&P 500 as our first example. If we take its daily price data from the past ten years and average it all together, something fascinating emerges. A "seasonal chart."
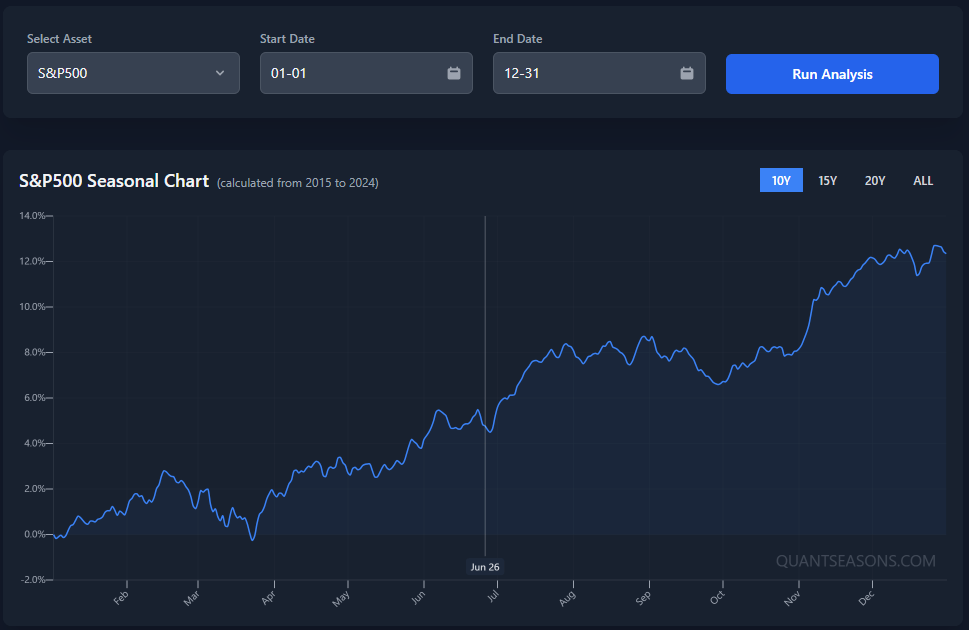
It's a visual roadmap of how the S&P500 tends to behave throughout a typical year. It shows the market's habits, its favorite times to rally, and its usual spots for a pullback.
Here's Where It Gets REALLY Interesting...
Okay, now lean in a little closer. Look at that chart again. You can clearly see the S&P 500 has an undeniable tendency to rally during specific periods of the year. Now, the beauty of QuantSeasons is that with just a click it allows you to highlight any part of the chart, to immediatly run a seasonal analysis of that selection. So, let's zoom in on one of these rallies on the S&P500.
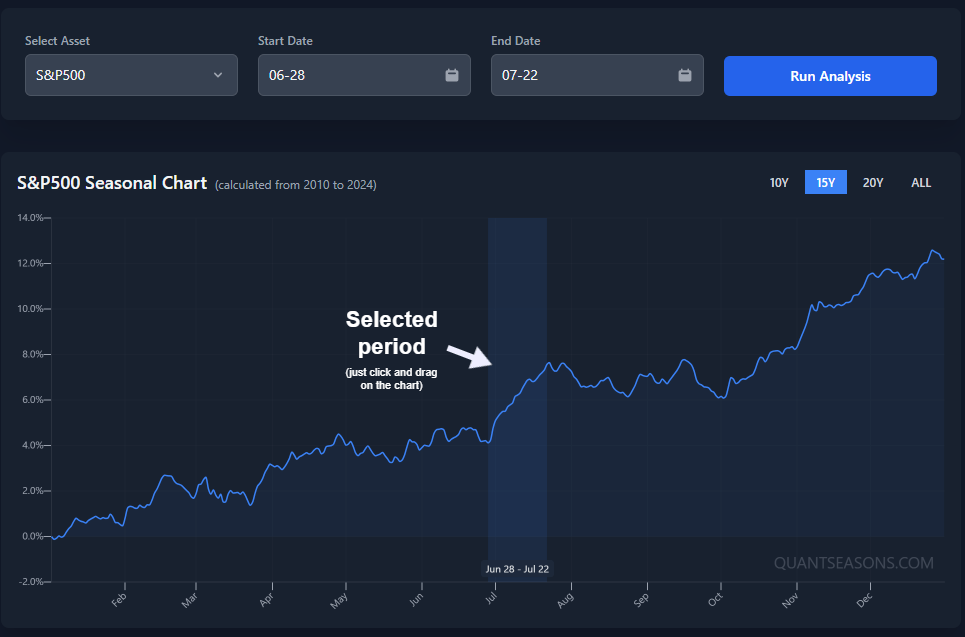
Get this: Over the past 15 years, the S&P500 has finished higher between June 28 and July 22... every single year. Not "most years." Not "about half the time." Every. Single. Year.
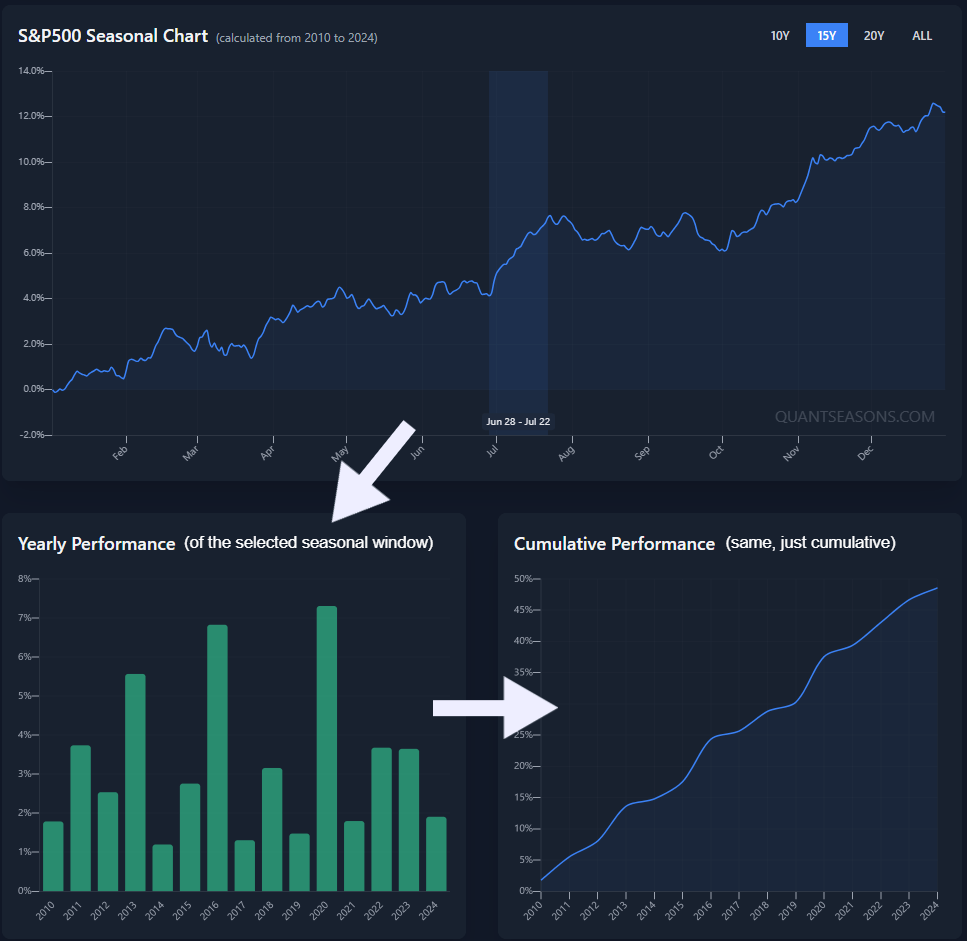
These are the kinds of statistical patterns that make professional traders sit up and take serious notes. But let's get deeper into this analysis. Once you scroll down on the QuantSeason's analysis you will see the data to prove it:
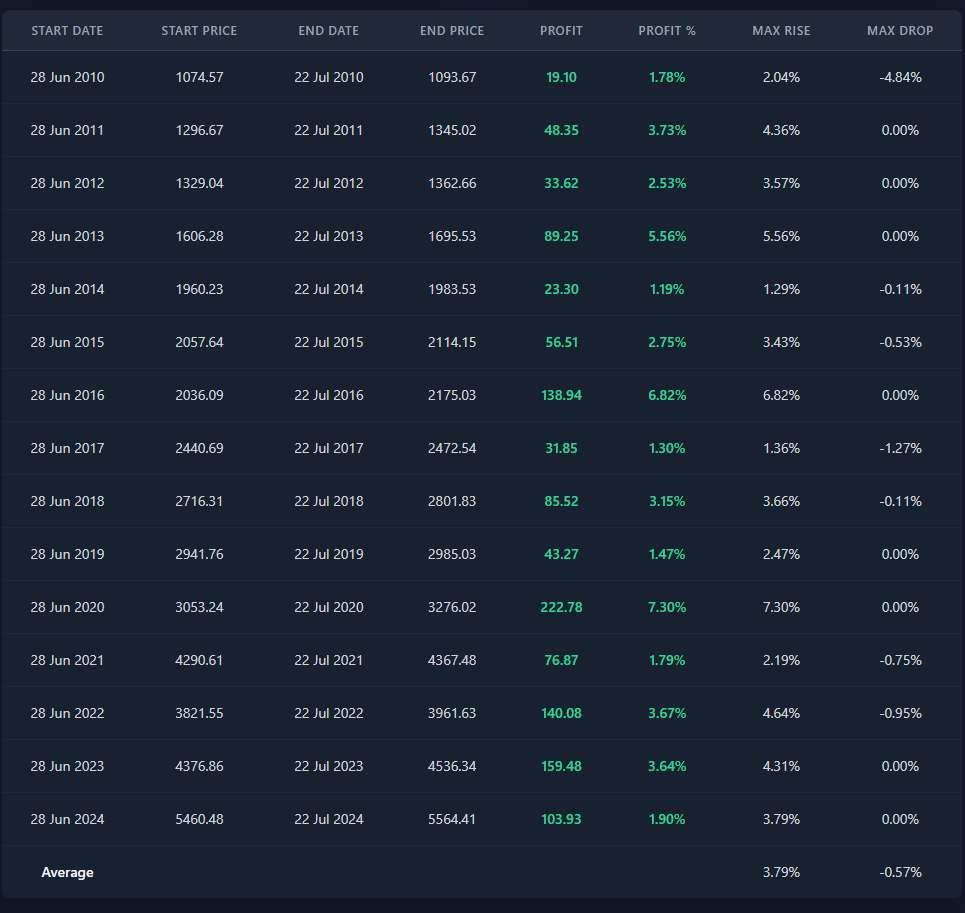
"Hold On... Are You Serious?"
I can hear you now. "You're telling me there's a specific time frame where an asset has gone in the exact same direction for 15 years straight?" Yes. That's what the historical data shows.
Is it random? Maybe. Is it useful information to have in your arsenal? ABSOLUTELY!
So, How Do the Pros Use This?
They use it to their advantage! If history shows that the S&P500, for whatever reason, loves to rally in early July, what's the smart play? You go long. You add to your longs. Or, at the very least... you avoid shorting. It’s about aligning your trades with the path of least resistance. And just to be precise, the analysis run above is up to 2024. So here's how the S&P500 performed in July 2025:
It followed the seasonal script perfectly.
Proof This Isn't Just Hindsight
Now, it's easy to look back and point these things out. But this isn't a history lesson; it's a practical tool. This is actionable intelligence, not just theory.
The Real Secret: Using Seasonality as a Strategic Edge
Here’s the bottom line... Seasonality gives you a genuine edge, one that’s rooted in years of objective data. It’s not based on a random indicator someone backtested over a weekend. It's a fundamental characteristic of the market itself. Try it yourself, you get 20 free analysis a day on the main analyzer 😉