Data that drives results
Your personal quant for seasonal analysis.
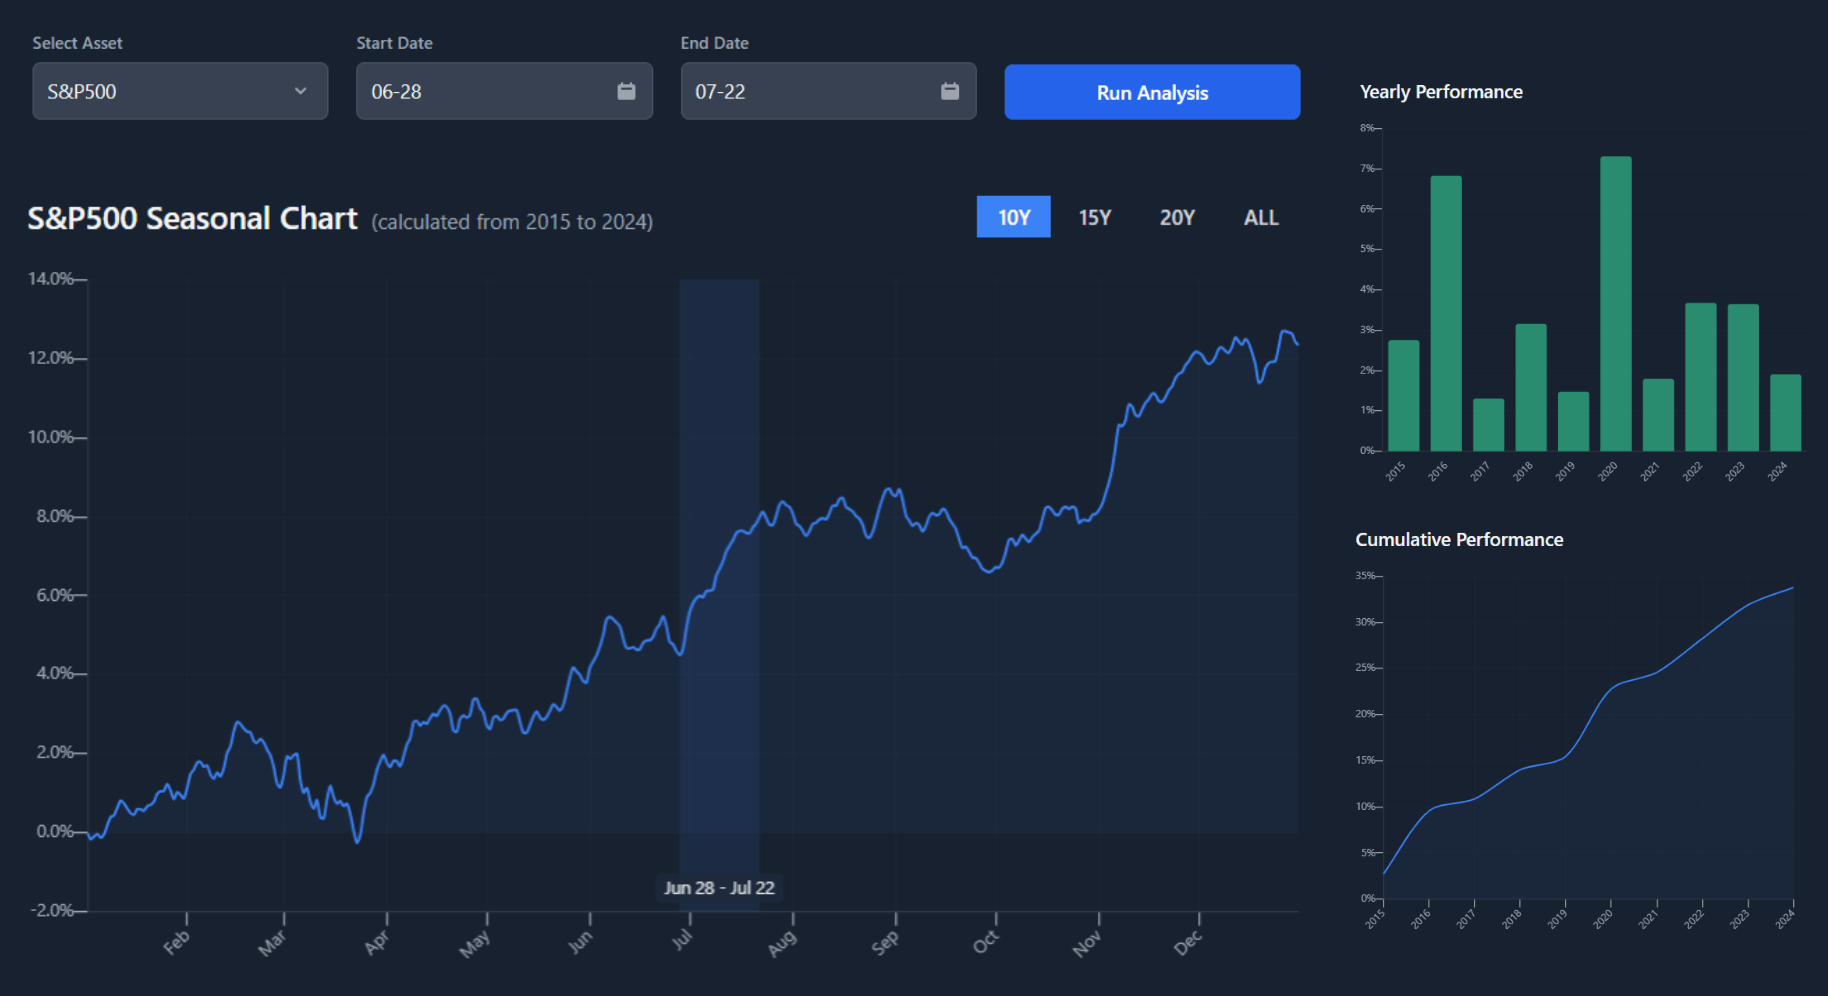
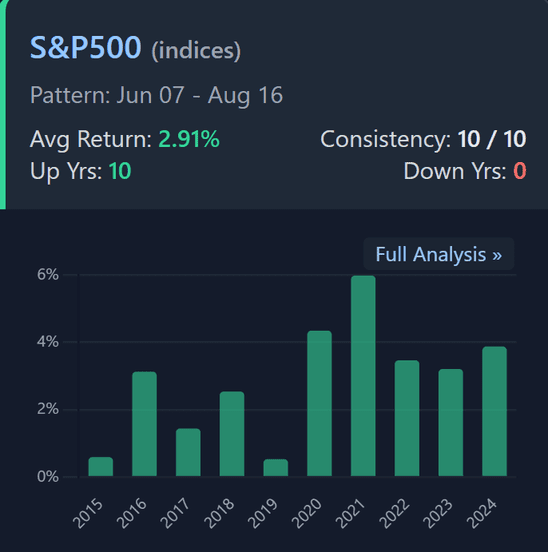
Analyze Seasonal Trends
Our intuitive charts reveal historical patterns at a glance. Identify an asset's strongest and weakest periods throughout the year to time your trades with precision.
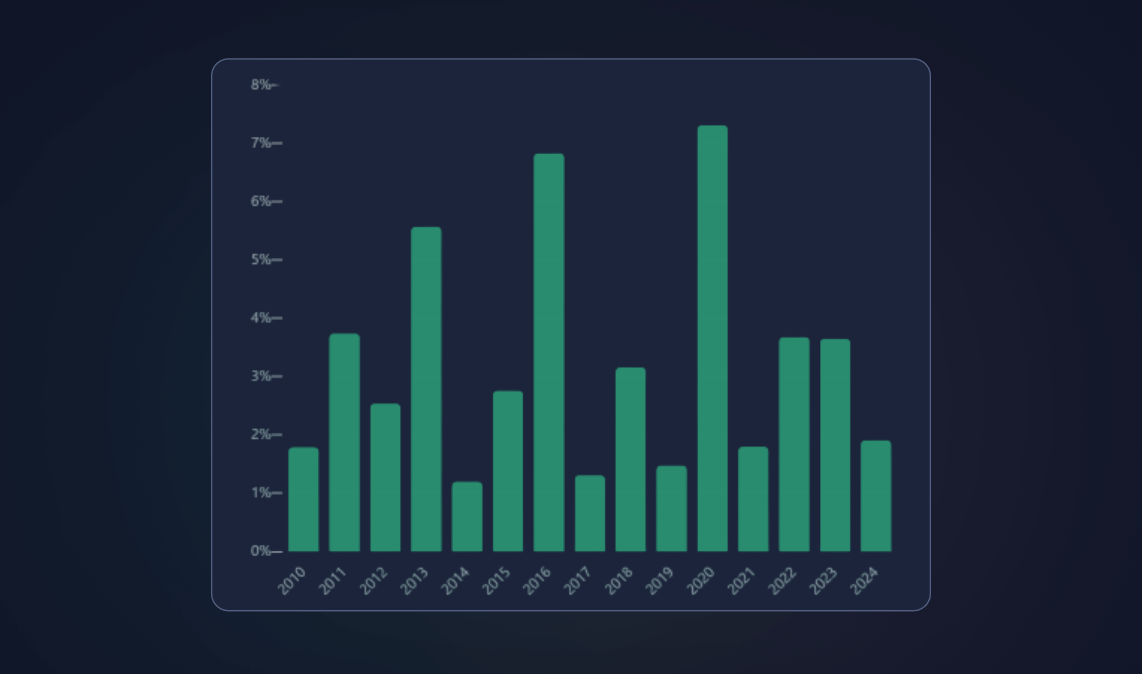
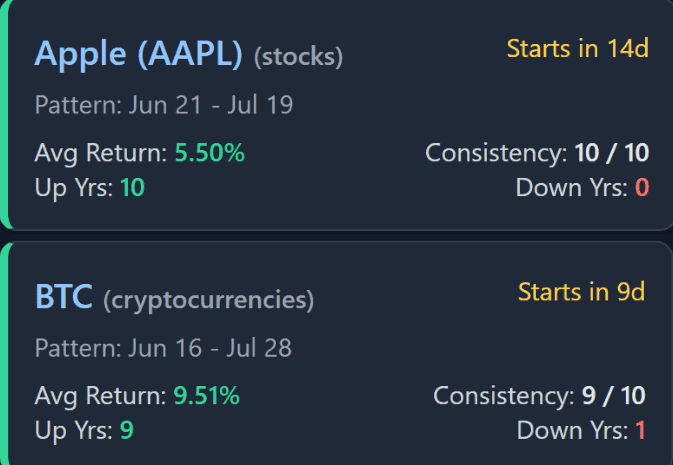
Learn moreDiscover Winning Patterns
Our quant scans through thousands of assets in seconds, delivering statistically significant trade opportunities to you in just a few clicks.
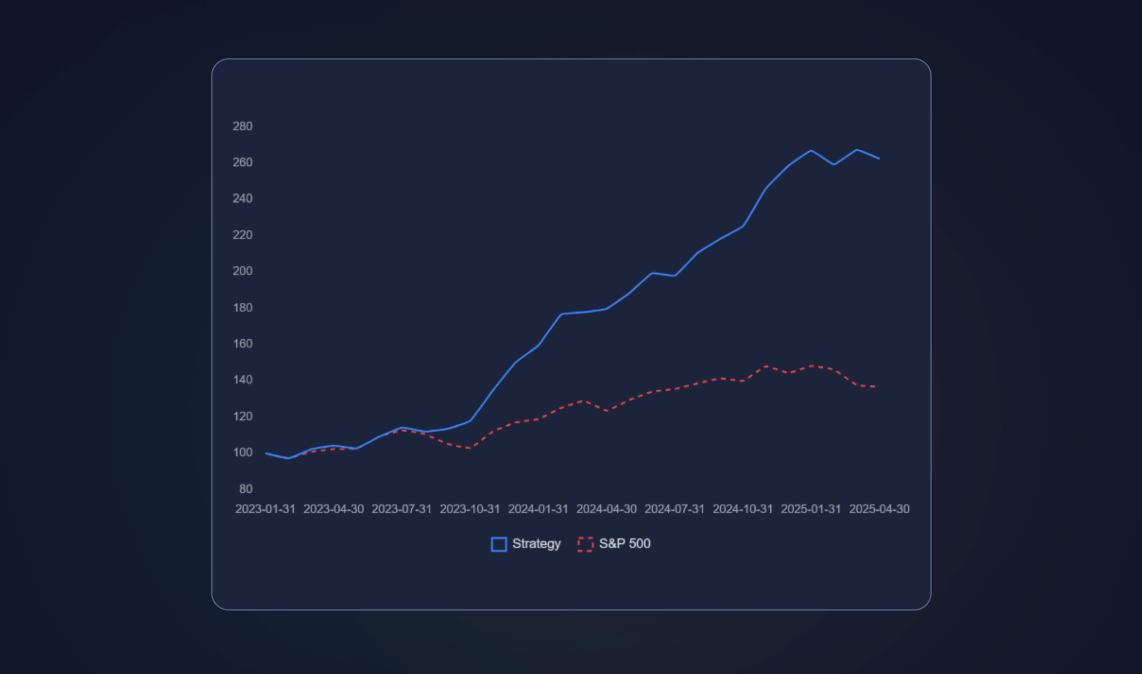
Learn moreFollow Curated Trades
Access trade recommendations from our proprietary algorithm. Each pattern is rigorously selected for its potential to outperform the S&P500.
Learn more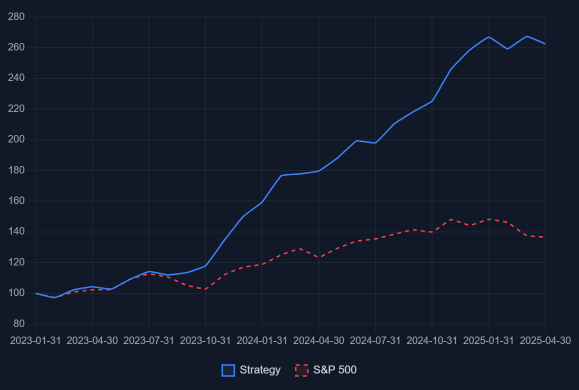
Find the plan that’s right for you
Start for free and upgrade when you're ready for unlimited analysis.
Free
Just the basics
$0/ month
(Free but limited)
- 20 Analyses / Week
- 5 YourQuant Scans / Week
- 5 Saved Setups
Most Popular
Pro
Unlimited access to all features.
$99/ year
(That's just $8.25/month)
- Unlimited Analysis & ScansNever miss an opportunity with unlimited analysis.
- YourQuant Custom Asset ScannerDiscover hidden patterns with the YourQuant scanner.
- Access to QuantStrategyOutperform the market with our proprietary strategy.
- Email Alerts For Trade OpportunitiesAlways stay updated with the best seasonal setups to trade.
- Save Unlimited PatternsBuild & track your personal edge with unlimited saved patterns.
Enterprise
Bring QuantSeasons to your company.
$599/ year
($49.92/month)
- Everything in Pro, plus:
- API access
- Priority support
- Request Custom Assets